Different CMMC reforms produce different DIB outcomes.
We modeled seven policy options for CMMC’s next phase across supplier survival, verification coverage, review capacity, cost, and security exposure.
Follow each option through 2049 and examine the tradeoffs across nineteen published measures. The results are conditional, not a forecast.
Model bf91444e3fcc · Assumption set graduated-verification-2026-08-13.v1
Read the tradeoffs together.
The same security requirements can produce very different levels of assurance, supplier loss, review backlog, exposure, and cost.
Read security assurance and supplier survival together. The mission needs current safeguards and a supplier base able to keep delivering; a program that improves one by sacrificing the other does not hold up.
These are median modeled results under the conditions stated for each policy option. Read the five outcomes together. This is a comparison, not a forecast.
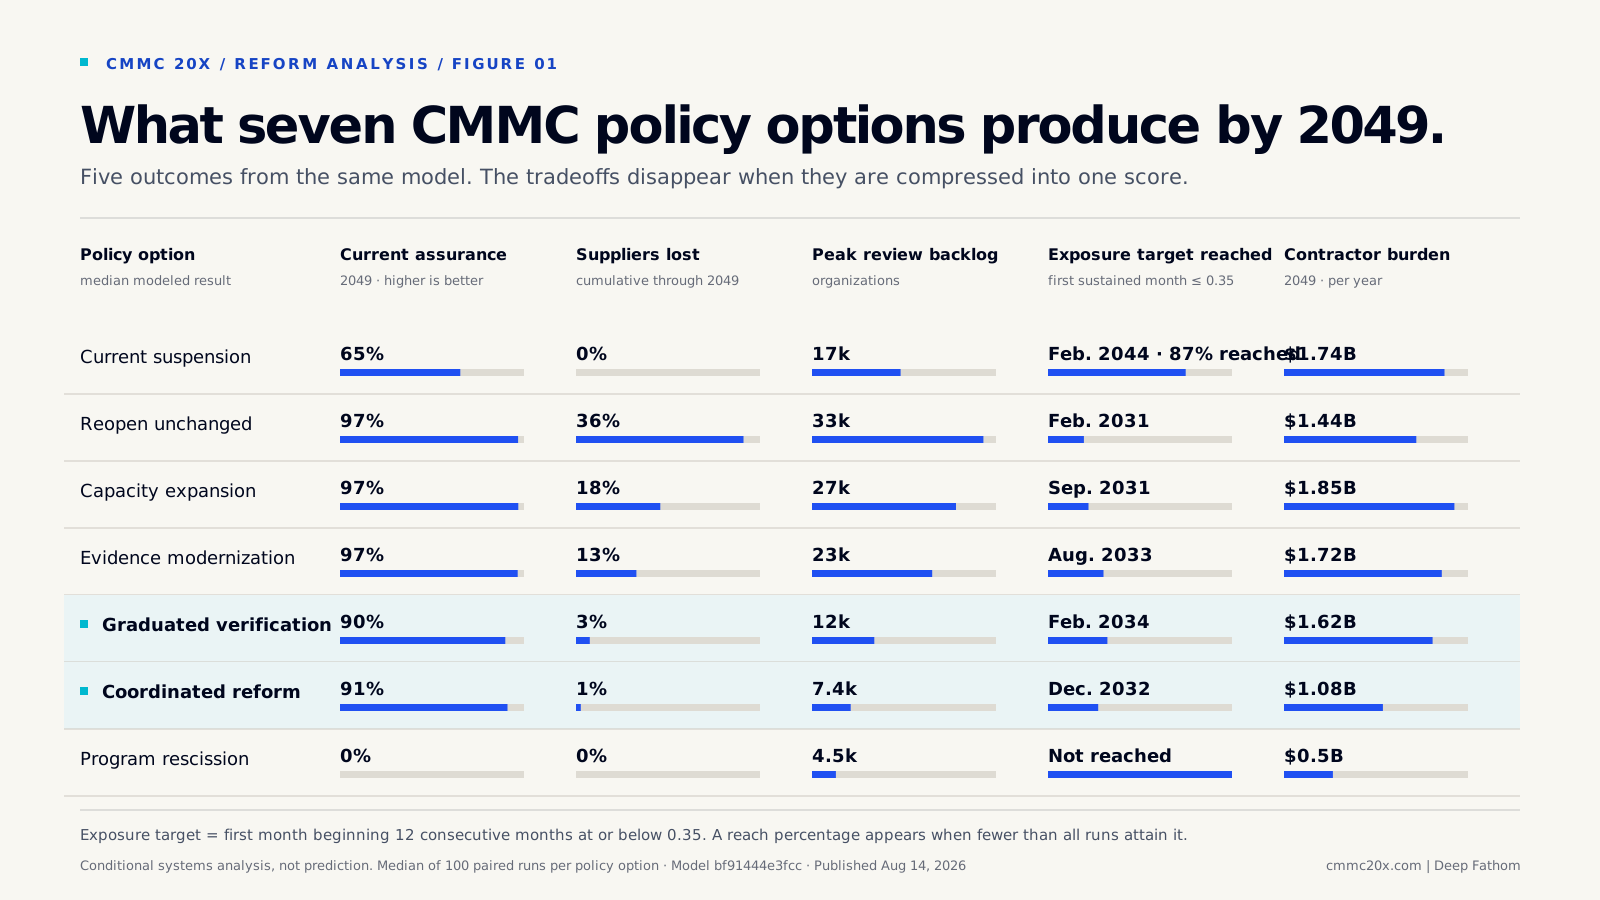
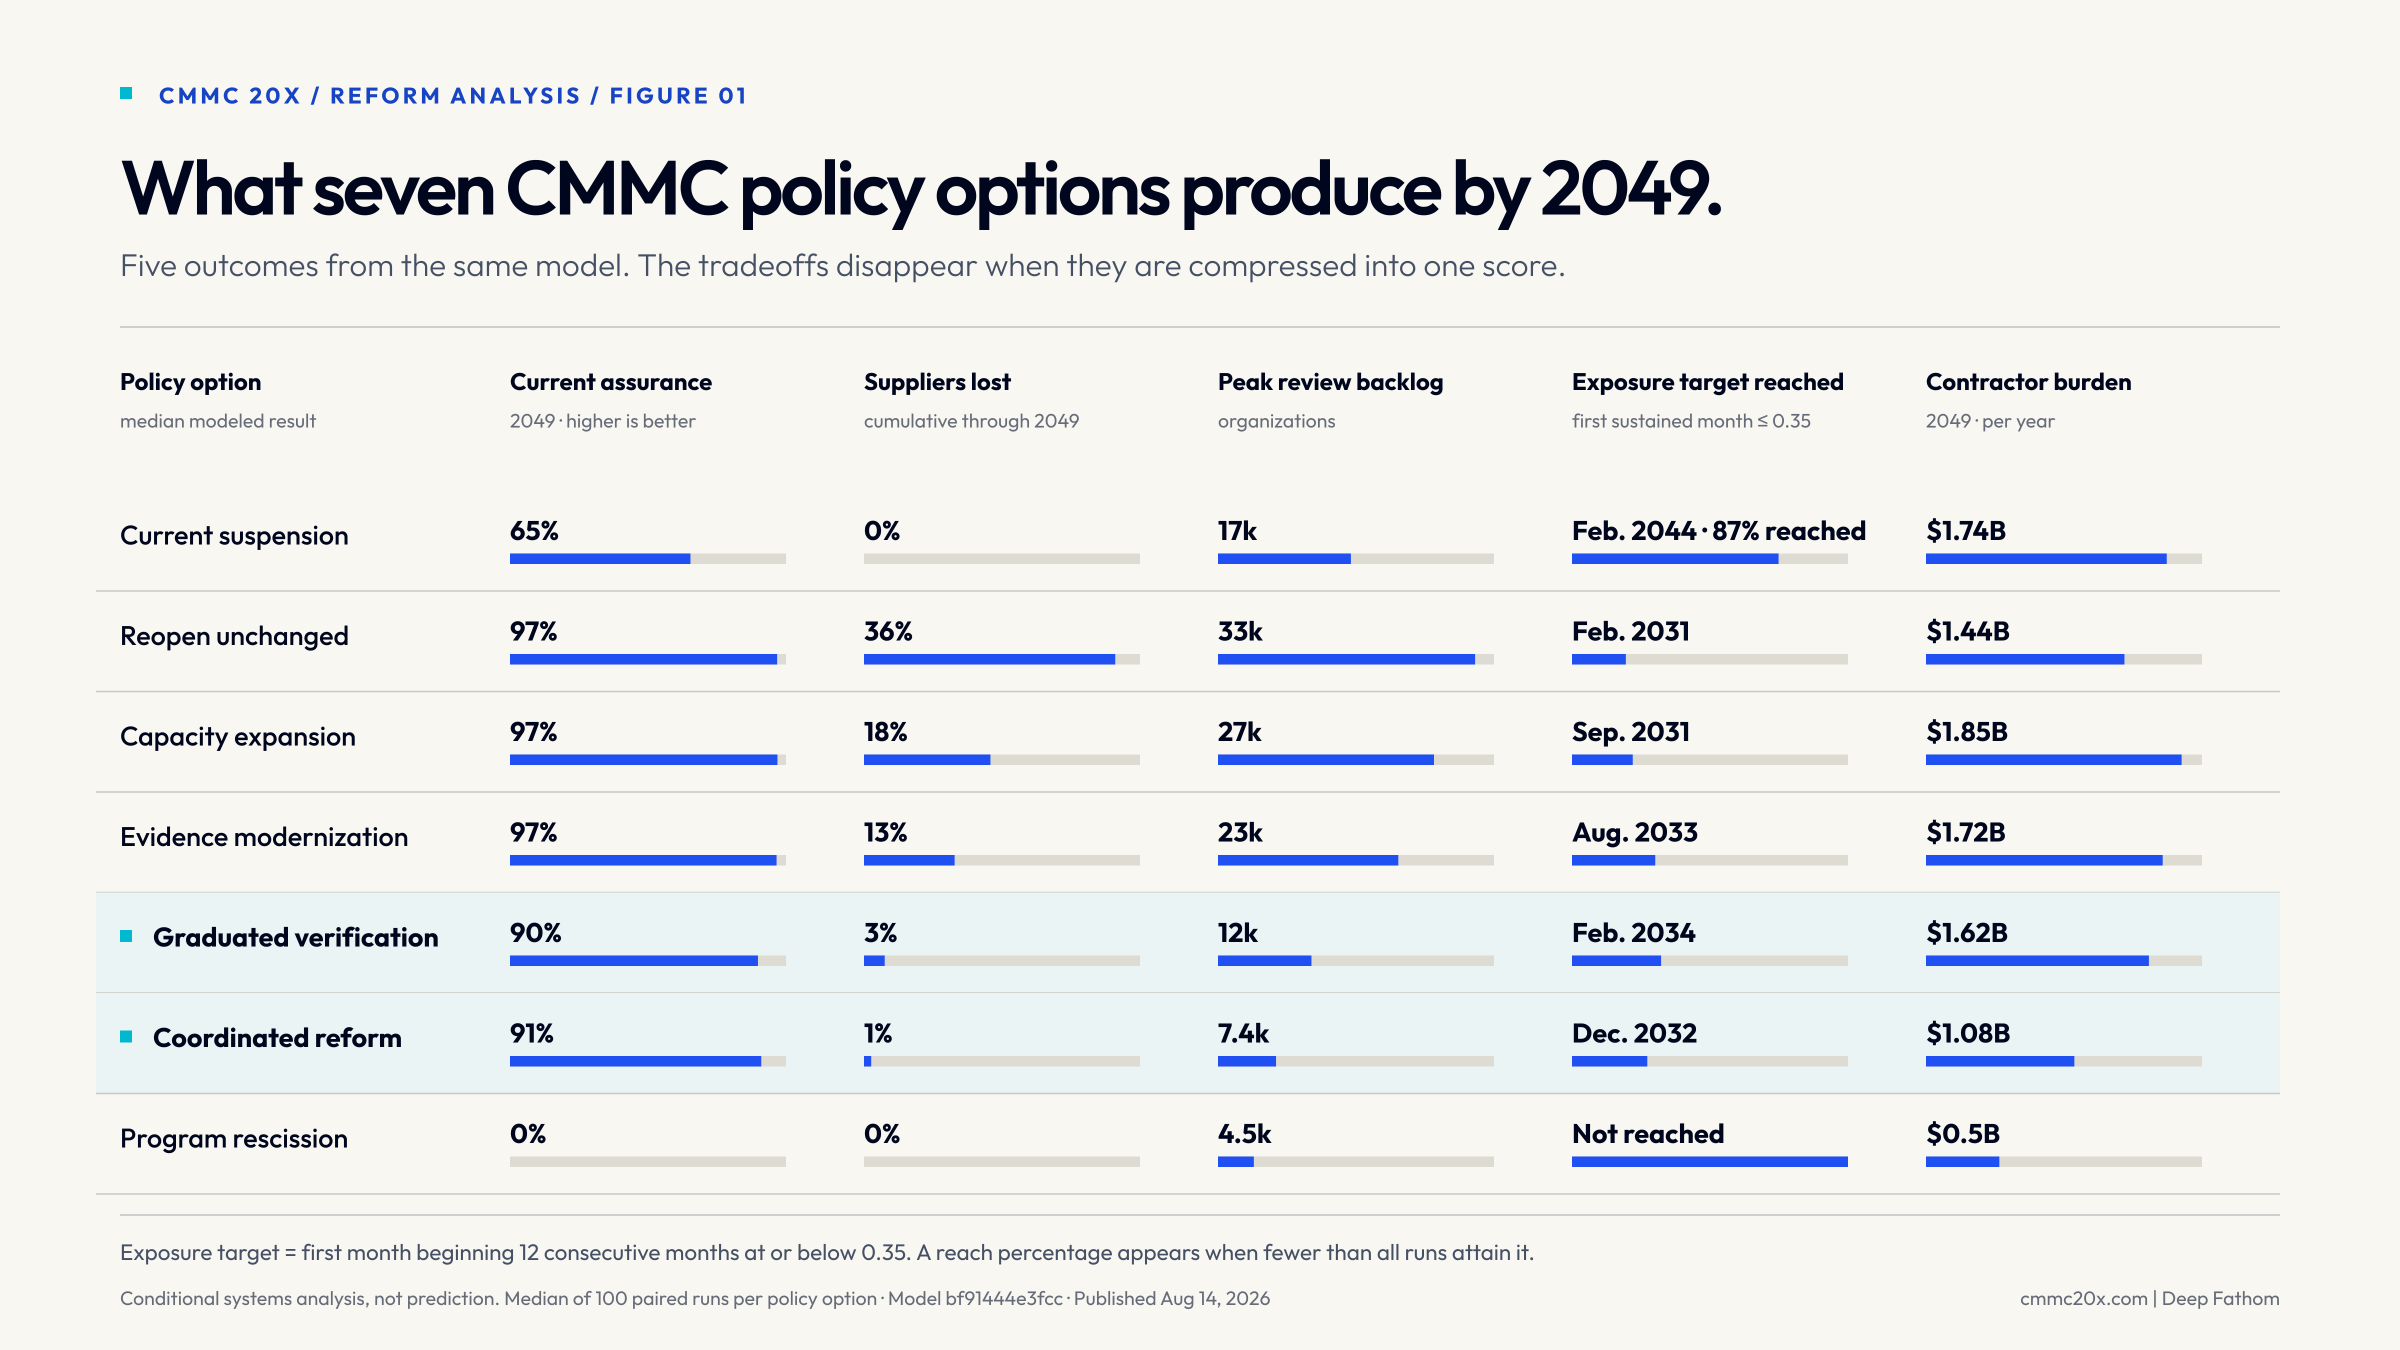
Read the figure as a table
| Policy option | Current assurance 2049 | Suppliers lost through 2049 | Peak review backlog organizations | Exposure target reached first sustained month at or below 0.35 | Contractor burden 2049 per year |
|---|---|---|---|---|---|
| Current suspension | 65% | 0% | 17k | Feb. 2044 (87% reached) | $1.74B |
| Reopen unchanged | 97% | 36% | 33k | Feb. 2031 | $1.44B |
| Capacity expansion | 97% | 18% | 27k | Sep. 2031 | $1.85B |
| Evidence modernization | 97% | 13% | 23k | Aug. 2033 | $1.72B |
| Graduated verification | 90% | 3% | 12k | Feb. 2034 | $1.62B |
| Coordinated reform | 91% | 1% | 7.4k | Dec. 2032 | $1.08B |
| Program rescission | 0% | 0% | 4.5k | Not reached | $0.5B |
Inspect each policy option.
Choose a policy option, then change the measure. The workbench includes all nineteen published measures, stress tests, resource costs, and implementation steps.
Selected policy option
Continue the current suspension
Keep the Phase 2 gate closed. Existing status retains its normal clock, and underlying safeguarding work continues, but no new policy-scale independent-verification demand is released.
The median ends at 65% in 2049.
Decision readout
Suspension buys time; it does not build a verification steady state.
Action modeledKeep the Phase 2 gate closed and introduce no replacement intervention.
Median current assurance reaches 65% by 2049 while attrition remains 0%. The approach never reaches the full outcome set.
Prime flow-down and voluntary safeguarding work continue at baseline rates, so implementation improves slowly. Without new contractual demand or a different route, current independent status grows much more slowly than the population-level requirement.
Use suspension as a planned implementation window with entry and exit criteria. Elapsed time is not evidence that the system is ready to reopen.
What could change this conclusion
The result is most sensitive to how much prime flow-down pressure persists while the formal gate remains closed.
Modeled cost
Where the money goes
Cumulative resource cost through 2049, split between implementing safeguards, maintaining evidence, contractor-paid reviews, and Government reviews.
Implementation timing
A decision is not yet an operating change.
For each action, the model tracks its start date, legal instrument, implementation delay, and chance of taking effect. The outcome chart assumes every listed action becomes effective; implementation risk is estimated separately.
This policy option introduces no new intervention.
Comparative systems analysis
- Whether an intervention removes a constraint or merely moves the bottleneck
- How implementation lead times interact with a deadline-clustered demand wave
- Why scope, verification routes, capacity, technology, and supplier survival must move together
- Which conclusions remain stable across different implementation conditions
Predictions or guarantees
- A prediction of what the Department or Congress will do
- Per-company readiness, cost, revenue, or breach probability
- Third-significant-figure precision or an exact implementation date
- A claim that any vendor, technology, or isolated lever is sufficient
See what has to change to produce a different result.
- Review structureHow graduated verification changes the route, correction, and escalation logic.→
- Supplier effectWhat scope, safeguards, evidence, findings, and later changes ask of a contractor.→
- Program decisionsWhat Government must define, test, sample, authorize, and correct.→
- Pilot designHow Government can test the working system against selected cases, measures, thresholds, and reviewers.→
- Written findingRead the seven policy-option results as an article with the conditions attached.→